Saturday, February 6, 2010

The Snowpocalypse of 2010


Here in Pittsburgh, PA we are experiencing what the yout's have affectionately dubbed the Snowpocalyse or Snowmaggedon (Snownami?) . . .

And it's beautiful.

It does, however, pose a variety of infrastructure problems.

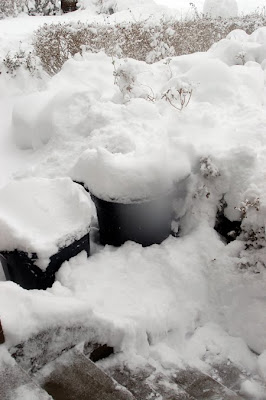
In the span of just over a dozen hours, the greater metropolitan area received more than 18" of snow. While last night it the coverage was easy to dismiss as a heavy but reasonable, today the difference was overwhelmingly clear.

11:50 February 5th vs. 10:30 February 6th

Currently, the Port Authority is running only one of it's 184 routes (an EBA, between Swissvale and Penn Station), with no projections for when service will return to normal.

This, of course, has more to do with the progress of the city's plowing efforts. Around noon today, the city had just begun plowing secondary streets. Now, 3:50, even Wilkins has yet to be plowed.

In reality, conditions have been deemed so bad that Governor Ed Rendell "...has declared a statewide disaster emergency to enable state, county and municipal governments to respond effectively..." (via Public Opinion.) Indeed, running "City of Pittsburgh" through Google today brings up the Snowstorm Emergency Information Page.

By midnight last night, the accumulation measured around 11.4" and has already broken several records including the Feb 5th 1899 record of 4.7" and the most snow received on any one day in February (the previous record being from February 20, 1947 at 10.4".)

Our local drifts ranged from ~20" near the edge of our steps to 25" in some places, with most vehicles boasting 10" shells.


In addition to residents being snowed in, flights coming into to PIT have been re-routed and flights out have been delayed indefinitely. More than 100,000 people are without power as the accumulation has snapped many lines, and various trees, including three on the Carnegie Mellon campus, have fallen under the additional snow-weight.


It's a little difficult to balance one's love and appreciation for such a mesmerizingly transformed landscape with the fact that it causes so much trouble on so many levels. Fortunately, for some, hopefully many, it's still a pleasant surprise and one worth enjoying while it lasts.


We can also take comfort in knowing that the city is hard at work doing all they can to improve conditions and restore access, just as citizens themselves work towards clearing their own small section of the world. It'll take a little while, but things will be back to normal soon enough. For now, enjoy the snow day.


Tuesday, February 2, 2010

This isn't so SNAPpy... [Oh SNAP!]

There's great news on the Government Transparency front: The city of Pittsburgh has collected and collated all of it's public planning data into one big document, for easy reference. They call it PGHSNAP, short for Pittsburgh Sector and Neighborhood Asset Profiles/Action Planning.

There's only one problem! It's a eight hundred page document, mostly maps, and all of those maps are at incredibly low resolution. Most of the maps, despite being saved in a file format perfectly able to handle high-density vector data, are vector files saved as low resolution images and pasted in.

Exhibit A: the Open Space and Parks Map


Looks OK, right? Here's what happens when you zoom into the PDF:


It's a pixel disaster the likes of which I haven't seen since the PDFs the Port Authority puts out. True, slightly higher resolution maps exist for each specific neighborhood, but you don't hurt anybody's pixels by making the city-wide map, you know, readable too.

Here's the deal, City, in case you never got the memo:

It's OK to produce detailed, data-rich documents. This is the Internet Age, we can handle it. And for god's sake, don't put text in images without extracting it into something searchable. I wouldn't have found this whole page of blight maps via search, even thought that's text right there:


And I guess this would actually be pretty interesting data, if I could zoom in on the maps at all without getting a good idea of the number of Vacant Parcels in Pixelville:


And as for PGHSNAP's sister Project, PGHGIS, I'll like you better when you don't have such intersting rendering-issues, and are a little more navigable:


This isn't transparency in government quite yet- its more of a hazy translucence, like windows that have newspaper taped over them. 

I'd love to find some real life examples of such windows, but the blight maps are too pixilated for me to see.

Oh. SNAP.

Monday, February 1, 2010

You Don't Know What You Got 'Til It's Gone, Especially When What You Got Is Your Property Tax Base [Paving Paradise]

Allegheny County Executive Dan Onorato does not like property reassessment one bit, which is bad because property reassessment is part of his job description.

Once upon a time, governments derived much of their revenue from property taxes, but in America income tax has slowly taken the lead. For the most part, American property tax dollars are the primary means by which local services (schools, fire protection, police, sanitation, etc.) are paid for. In Pennsylvania specifically, it is used primarily for supporting local school districts.

The Uniformity Clause in the State constitution allows different counties to tax properties differently, but requires that within any one county the tax is done in a uniform way. This seems like it would work simply in the case of property: just set the tax to be a blanket percentage of the property value of each property in the county. Uniformity? Absolutely.

The problem: how do you actually determine the value of a particular property in the county, and how often do you reassess that number?

Until the late eighties, the state required that every county do a full reassessment annually. In Allegheny county's case, this was done generally by looking at sales prices of properties in different areas, and using those to push the "assessed value" of the surrounding properties up or down a blanket percentage. That is to say, if the market in, say, Edgewood went up two percent over last year, the properties in Edgewood would all be reassessed two percent upwards.

When a given area's assessed value started getting out of whack with its real value, the county would do a "real" assessment again.

All through the nineties, various suits plagued the County over this practice, since the areas that got reassessed "for real" got reassessed heftily upwards 85% of the time, creating disparities in assessed value vs. real value between areas that were targeted for reassessment and areas that were simply recomputed.

Finally, thanks to a court order, in 2002 a county-wide reassessment was performed. Soon after, Dan Onorato was elected County Executive. He put a freeze on reassessments, choosing instead to regard 2002 as a "base year" and simply collect property tax based on every properties 2002 value. Since all properties were "really" reassessed in 2002, this would seem to satisfy the Uniformity Clause.

Not so fast, Dan.

The state law about using "base years" to compute property taxes does not require periodic reassessment at all. 2002's data can be (and has been) used indefinitely to compute Allegheny County's taxable property values. This creates its own set of disparities, as areas where property values have gone down (and, consequentially, the real net worth those area's residents have has gone down too) are now being overtaxed, while areas where property prices have risen are being undertaxed.

Three separate complaints have made their way all the way to the state supreme court, which ruled (pdf link) against the county's current practice and demanded an immediate reassessment. It's a pretty epic ruling, well researched and written, with a great introductory quote from a 1909 court decision:
“Controversies growing out of the assessment and collection of taxes are as old as civilization. To question the assessment, to doubt the levy, and to delay the collector may be classed among those inalienable rights of mankind not guaranteed by any Constitution, but very generally asserted under the law of human nature.”
-Delaware, L.&W.R. Co.’s Tax Assessment, 73 A. 429, 430 (Pa. 1909).
Essentially, the court found that by indefinitely re-using 2002's numbers, the county was levying taxes in a sufficiently non-uniform manner as to be unconstitutional, specifically that "The Allegheny County scheme, which permits a single base-year assessment to be used indefinitely, has resulted in significant disparities in the ratio of assessed value to current actual value in Allegheny County."

Onarato, though, will have none of it. Though there is clear wording in the decision telling the county to reassess and instructing the lower court to see that through, the County Executive (and as of October 2009, candidate for Governor) had made it clear that he will not be carrying out such an assessment, and plans as Governor to address the situation at a statewide level.

Now, City Squid understands why the early Aughts were a time where reassessing property value seemed like a bad idea. The real estate market was clearly bubbling, and to let county income be based on such a volatile measure is foolish at best. But to cling to 2002's numbers indefinitely is equally foolish. We can see why, though: when the reckoning comes, and assessed value finally catches up to real value, heads will most certainly roll, either because the population feels slighted for having been overtaxed for so long, or mad as hell that their taxes just got hiked so high.

Our thought: better in the long run though to be fair and accurate and unpopular, than willfully ignorant of your own tax base's value.

Saturday, January 23, 2010

From the City Paper: Water Torture [Link-A-Saurus]


City Squid would be remiss if it failed to exhort its readers to check out Chris Young's great exploration of Pittsburgh's aging water-and-sewer system in last week's City Paper, aptly called Water Torture.

Friday, January 22, 2010

Panel on Pittsburgh's Transport Future [Bus-O-Matic]


On a cold winter day, nothing warms the heart like a half-full Port Authority bus pulling up to your stop, its open doors pouring warmth onto the street like Bacchanalian wine. And nothing curdles the heart more than that same bus, full, zooming past, splattering your pants with oily road-slush. Twenty years hence, such a dichotomy might be a thing of the past.

Today, Carnegie Mellon, and specifically the Smart Growth Club, a student initiative based in the Heinz Business School, hosted a panel on "Transportation and Economic Expansion in Pittsburgh", looking at how transportation might grow and change in the next twenty years. The Traffic21 Initiative also helped host.

The panelists were a who's who of the public, private, local, civic, county, and state organizations involved in transport decisions in the city, moderated by a man who has served, over his career, in all of those catagories: Allen Kukovich, currently the Director of the Power of 32 Regional Visioning Project and a former PA State Senator.

Panelists included:

Breen Masciotra – Director, Uptown Partners (website is apparently a placeholder)
Councilman Bill Peduto – Pittsburgh City Council, District 8
Court Gould – Director, Sustainable Pittsburgh
Patrick Roberts - City of Pittsburgh Principal Transportation Planner
Stephen Bland – CEO, Port Authority of Allegheny County

The panel was an hour and a half long, and the time was divided roughly thus: fifteen minutes of general introduction, thirty minutes of short introductory comments from the panelists, thirty minutes of the moderator directing audience questions (written on index cards) to various panelists, with just a hint of back-and-forth between them, and then fifteen minutes of closing comments from the panelists.

Almost all the panelists opened by bashing the "purgatory" of low-density, high car-use suburbia, a big initial "we don't want that" caveat. Further talk trended towards the need to fix and creatively reuse the systems and infrastructure already in existence before talking of huge new projects. As Bill Peduto put it, "We need to fix city roadways up to the era of Duran Duran, at least."

Steve Bland mentioned a few exciting Port Authority upgrades, especially the introduction of Smart Cards, electronic bus passes that would be easier for consumers to use, harder to fake, and provide PAT with much more data on their riders.

He also mentioned the need to get real-time data to riders. According to market surveys, he said, if a person waiting for a late bus still knows how soon it will be arriving (is it two minutes late? or ten minutes late?), they are twice as likely to perceive the system as being "on time", regardless of how off-schedule it is.

(Very recently, the Port Authority actually opened up all of its scheduling and route data in Google's Transit Feed Specification, though with a pretty restrictive license that disallows modification and warns that a licensing fee might one day be instituted. This begs the question: why is a public utility's data not completely open and free to its public?)

Finally, he discussed ways in which the bus system (which contains 90% of PAT's overall ridership) could become more train-like, with bus terminals and stops that were not only efficient, but beautiful, appropriate, and which felt like real places integrated into their respective neighborhoods.

Steven Roberts had a lot to say that reinforced the above points, and added his own thoughts regarding cycling. He seemed like he had a lot more to say, seeing as he is the city's Transport Planner, but time was pretty limited and much of that talk was curtailed to a couple of buzzwords, most notably Livable Communities, Slow Streets, and Complete Systems (rather than Complete Streets).

The other two panelists got a bit edged-out of the panel-time (and my notes), but Sustainable Pittsburgh's Court Gould did make one striking point during his brief mic-time: there is no need to "balance economic development and transportation development. We can predicate economy on transport."

In all, it was a pretty optimistic panel. It looks like there are quite a few smart people thinking very hard about Pittsburgh's transport opportunities as time moves on. They did, though, all seem to be waiting for the money to come in for new projects and ideas, either from the federal government, from a restructure of local monies, or from public-private partnerships that have yet to materialize. It makes one wonder if there are ways that the money currently being spent could be spent in more interesting or efficient ways.

City Squid likes to think about these problems.

A few easy-to-implement ideas that the panel missed:

  • Posted, relevant schedules at every stop. This can be done today- many bus shelters are actually paid for by advertising companies, but have areas where such schedules can be posted inside the shelter.
  • Downloadable and printable schedules that are slightly more bespoke than currently available (pdf link), letting one print out, for example, a schedule of all of the busses that pass through a specific stop, with the relevant junction-points further afield calculated and specified.
  • Bus schedule and route data made available online- in an open format. 
  • Serious development to make that data available via the mobile web, via cell phone txt queries, and with a sensible web interface.

And a few ideas that are a bit harder, that the panel did cover:

  • GPS transceivers on every bus. Real time scheduling corrections and shifts. Better metrics on lateness, clumping, etc. Data-driven schedule changes.
  • Live feedback at bus stops. 
  • Electronic fares and passes.
  • The better rider data generated by the above ideas rolled back into route and schedule planning.

One can only hope that these ideas get implemented, and implemented well.

A final thought, the one that Bill Peduto chose to end on:

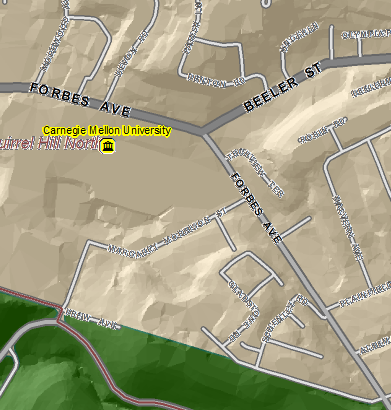
The city has, currently, a pretty-much-unused rail line that from Lawrenceville past Carnegie Mellon and down to the Monongahela river. It is ripe to be transformed into a commuter rail, one that could be the beginning of a region-wide rail system serving from Washington to Meadville. This line's right-of-way is so perfect for intra-city transport that its existence is near-miraculous to us, as we have forgotten that the region was built around rail lines, not the other way around.

As the Councilman says, "fix it first."

Tuesday, January 19, 2010

The Refresh Rate of the Real World [Digital Density]


(Times Square Photo from flickr)
What if all we had was photographs? What would future people guess our world was like? And if they had millions of photographs to search through? Billions? What would they come to understand about 2010 if they had just a photographic record?

Times Square, New York City is not the most photographed place in the world, according to a study of all 35 million geotagged photographs on Flickr, but it is in the top hundred. Does that make it an important, historical place?

Digital cameras have outsold film cameras for nearly a decade, and every year they get lighter, smaller, and able to hold more photographs. People take more pictures with them, and more of those pictures get shared with the general public on Flickr, Facebook, and other social platforms. Times Square, then, will only become more photographed as time goes on, and as time goes on more and more of that photography will enter the near-public record, on Facebook, Flickr, and other social sites (not to mention whatever ends up part of Homeland Security databases, etc). What sort of world will all that data show off?

We already have such a photographic record, and I think we can start answering those questions.

This photographic record is getting more metadata-rich too. Metadata is data about data- in the case of photographs, things like the time and day the photo was taken, the latitude and longitude of the camera, who took the picture, what the light was like that day, and a host of other things.

As cellular phones and other devices incorporate better and better digital cameras, and as stand-alone cameras add better and better features, digital capture devices can add more and more metadata to those photographs, from Coordinated Universal Time (UTC) to specific GPS geo-tagging.

As recently as two years ago, Microsoft and the University of Washington began taking advantage of all this tagged and coded photo-data to build Photosynth, a software package that generates three dimensional models of heavily-photographed areas, as well as stitched-together continuous images of that object. This is their demo video, from 2008, showing their model of St. Peter's Basilica:


It's a pretty neat demo, but it is also a demo of a highly photographed space, on the order of Times Square or the Eiffel Tower. Sitka, Alaska, on the other hand, probably doesn't get photographed nearly as often, and would not have made the most interesting of demos.


It may sound obvious, but there are a couple of reasons for this. Sitka is remote: it's a major fishing port, and a stopover for Alaskan tourism, but not an international trade center nor an airline hub. Not to be cruel, but Sitka is less important to the vast majority of travelers than the commercial spectacle of Times Square.

One may note from the video above that so photographed is St. Peter's Basilica that the video-authors can actually show the progression of an event registration just by browsing deeper into the future-end of the time-scale of the photos taken and seeing volunteers arrive, chairs unfold, and up spring tables.

If the photographs taken of a place can be imagined as a hyper-rectangular volume populated with photograph points set in space, (as they are in the above video) and perhaps colored by time (red is the past, blue is the future, a feature not in the video), but limited to an hour or a day or so, then one can see that Times Square would be a virtual sea of reference-frames, with thousands and thousands of data-points, many of them overlapping spatially, but splayed across time (implying that there are certain iconic shots that everyone wants to capture). But not all places in the world could boast such a crowded ocean of data.

The photograph of a woman standing in front of Sitka National Forest has no such overlapping photography. Instead, its volume would show something more like a wandering line through space and time, with just a few photo-points demarking its passage. From the photostream the picture is part of, one can see that it is part of a series of vacation photos, a single point in a long, narrow tunnel of personal experience, nowhere near as data-rich as an intersection like Times Square or a landmark like the Basilica.

If one extended the time-frame of the Sitka National Forest volume to a week or so, one might come upon a few dozen more such tunnels-through-space-time, whose various photo-points might reveal what people in general find interesting at the site (the totem pole, apparently).

Comparing these three space-time volumes (Sitka, Times Square, and St. Peter's Basilica), one notes that, beyond the data conveyed by the photographs, there is meta-data that can be derived from photographic density. Density, in this case, is almost shorthand for interestingness or famousness. The thought might be I was here at this important thing, and that makes me a little important too. Let me record this temporal-spacial meeting.

If one was mining this photographic data for, say, an idea of the number of people who were at a rally, or what might have happened during a riot, then density of photodata around that event is a key factor.  Places that are heavily photographed, in effect, can be more accurately surveilled -- the gaps in the record are correspondingly smaller.

So when historically important events happen at famous or crowded locations, this meta-data composed out of many different photographic references becomes magnified, sometimes overwhelming the photographic data itself. An act can appear innocent or incredibly guilty, depending on exactly how it was captured on film. If a man spends five minutes tying his shoes, is he really clumsy, or is he watching someone? The photographic record can save or damn him.

The Kennedy Assassination, for example, has been so scrutinized that every single frame of the famous Zapruder Film has been carefully scanned and preserved, and various conspiracy theories have arisen not based on what was in that series of 18.3 photographs/second, but on what might have happened between frames and whether or not the between-frame events make sense. The questions arise not because of the data itself, but because it is not dense enough.To use a more computer-era phrase, the Zapruder Film needed a higher capture and refresh rate. In general, history would be better understood if data on Dealey Plaza refreshed faster for those key seconds (The Watchmen movie used this data paucity to great effect (at 2:43)).

In a way, one can think of photo-density as bandwidth: data-transfer between the real world and the nebulous digital record that shadows it. The Zapruder film is like a bad dial-up connection: there is a lot of noise mixed in with all that signal. Times Square, on the other hand, is like broadband- a veritable river of data. Sitka would be like a satellite phone: often off, but data-heavy when in use.

But does photo-density actually improve surveillance? I would argue that it doesn't. If photo-dense places are people-dense places, then there are a vast number of crimes, from murder to rape to robbery, that simply would not be captured in the public photo record, as they are not crimes one commits around big crowds of people.

My guess is that the photo-density in the real world is only going to increase as time goes on, and that the higher it goes, the more and more metadata we will figure out how to draw from it. The number of places data-rich enough to be accurately and usefully modeled in both space and time will only go up. The algorithms for enmeshing all this photo-data and recognizing real-world objects within it will only get better. The willingness of people to add their own photographic data to the general data will go up (though whether this is out of a newfound cultural sense of the commons or because a form online somewhere is set up as an opt-out rather than opt-in remains to be seen).

In the future, Times Square may still be highly photographed in the public record. But the rest of the tail of that graph will have seriously caught up.

I doubt that this spread of photo-density to more places will do much to improve security, capture more criminals, or make huge discoveries about human interaction.

No- I think that its ultimate contributions will arrive in the same ad-hoc way that its data does- small, interesting, strange patterns that careful, persistent data-mining will make quite clear.

Monday, January 18, 2010

From Potholes to Political Pavement: Road Repair in Pittsburgh [Urbanism]

Destroyer of axles, wrecker of undercarriages, bane of wheel alignment, tireless foe of tire tread -- ladies and gentlemen, I present The Pothole.


This bad mother lived over on Negley Ave, just north of Fifth Ave. Negley is a main artery from Squirrel Hill down into Shadyside, Bloomfield, Friendship, and Garfield. From Wilkins one can take it down one of the steeper grades in the city, across Fifth, and right into this pothole, which sits on the far right side of the northbound lane.

Busses (especially the 71s and the 500) use Negley to get to Center, and I've seen a couple of them enlarge this sucker as the pass, ripping little pieces of the roadway off and out.

It took the city six days to fix this bad boy, from my notification to them on the 8th, to further notifications on the 11th and 12th, to its ultimate repair on the 13th.

It's clear what potholes are -- big holes in the road where the road surface seems to have collapsed or been removed, leaving bare earth (or sometimes gravel) underneath.

The word Pothole (and the synonyms Kettle and Kettle-hole) was first used not by angered motorists, but by naturalists and geologists, to describe pot or kettle-shaped holes, usually quite large, formed by the gradual spiraling erosion of those rocks by nearby water sources (usually rivers or oceans).

Essentially, natural potholes are formed when pebbles settle into a depression in a rock, and then are washed repeatedly across the rock-face by flowing water. As the pebbles spin round and round the depression, they slowly carve it out, forming a hole many, many times larger than the pebbles themselves.

Road-potholes are great analogs to natural ones, but require a little more explanation.

The smooth, even road-surfaces we are used to are a pretty recent innovation. They are made of asphalt or concrete, both words that describe pliable mixtures of mineral aggregates (gravel or rock or sand) and a binding agent that glues this slurry together. One heats the mixture up, pours it onto the road that needs surfacing, and compresses it to cool, whereupon it hardens into a smooth, glossy driving surface.

It is, of course, not that easy.

First, one needs an appropriate road-bed to put this surface on -- hardpacked stones and gravel that won't erode away if the ground around it does. If the underlying roadbed is too weak, or starts eroding, then the cemented surface above it will start to stress, crack, and break.

Second, really strong asphalts are both expensive and temperamental. Both the binding agent and the mineral aggregate in any given mix have a large scale of options, and the best-of-the-best can cost probably two orders of magnitude (100x) more than the cheap stuff. Additionally, the strongest cements can only be laid down in the summer months, as the longer they take to cool, the stronger they are, and the less likely they are to crack. Even worse, if one paves in winter, the mix cools before it can be properly compressed and shaped.

Most municipalities opt for the (pardon the pun) middle-of-the-road options when it comes to construction and paving -- not God's Own Paving Slurry, but not Pebbles-N-Spit either.

The More You Know:

There are actually two famous Scottish men named M(a)cAdam in history. John Loudon McAdam, no 'a' in Mc, invented the modern way of paving roads (mineral aggregate + binding agent), while John Macadam, 'a' in the Mac, is known as the botanist who discovered Macadamia nuts!

The middle-of-the-road stuff is, of course, susceptible to nature's wrath, especially the wrath of water. General erosion, combined with the heat-and-thaw cycles common to Northeastern winter, do much to soften roadbeds. Hundreds and thousands of cars (which it should be noted are thousands-of-pounds machines that rest on just four contact-points) traveling over the road-surface every day, pounding snow and water and dirt down into it, does the rest. Stress cracks form, fill with water, freeze and expand, over and over again until the tires of the cars can get a bit of a foothold on the crack-lip and start tearing out the very surface they rely on. A pothole forms, and as cars pick up the gravel in the center of the hole and push it towards the edges, or slam their tires into the new couple-of-inches-deep sides of the hole, the kettles get bigger, and bigger, and bigger.

Just like their natural counterparts, potholes that also hold water grow the fastest, as the water actually washes all the abrasive gravel back into the center of the hole, making the hollowing process even more efficient.

Pittsburgh's roads have even more complications than the average city. We are an old city, without much of a grid, built on many, many hills, and many of our streets are paved-over cobblestones. Additionally, we have a couple of the steepest streets in the hemisphere. Also, our public transport busses and delivery trucks can actually pull roadways apart when they stop repeatedly at the same places.


Here is one such stress-crack, at the bottom of Murray Avenue in Squirrel Hill.

All of this is to say: Pittsburgh has potholes, and new ones form every winter, quite reliably.

Bram Reichbaum wrote an excellent expose about Pittsburgh's paving and pothole filling habits over at his news-blog-paper The Pittsburgh Comet. Essential conclusions: the city has no money, and prefers to ignore the little problem --- sealing cracks, reinforcing obviously-deteriorating roadways, filling sprawls and holes and joints, and noting frequency of repair, all of which costs not-small amounts to fix -- and let them snowball into larger problems (potholes or even Capital Investment-level repairs), which cost much, much more to fix. This would be fine, except that by the city's own admission (pdf link to their 2009 Street Maintenance Audit), ignoring preventative maintenance and only fixing problems when they become public, political problems, is wildly more expensive than just fixing things right, once, when they are small.

It gets so much better, though.

As mentioned above, in winter it is too cold to effectively use hot asphalt to fill potholes. Instead, the city uses what it calls cold-fill, which should be called coal fill. Cold-fill is, no joke, bituminous coal mixed with tar. Coal. Coal, heat-your-house-with-it coal, is used to fill thirty- to thirty-five thousand potholes every Pittsburgh winter. It is grossly ineffective, and many of those 35,000 potholes are therefore repeat offenders.

As they say in the movies though, follow the money. Cold (Coal) Fill costs $69 a ton. Rapid Set, an asphalt mix used by Columbus and Cleveland to great effect, costs $12 a bucket, or (assuming a five gallon bucket weighs seventy-five pounds, which is a low estimate based on this datasheet) $320 a ton, an almost fivefold increase.

Even better is the asphalt mix that the city has started to use to repave streets. Called Superpave, it has been adopted by the state as the go-to mix for repaving streets and highways. Unfortunately, though it was touted as being able to last ten or fifteen years, the parts of the PA Turnpike that use it have cracked in just five.

Besides logistics and funding, potholes (and paving generally) have turned into quite the political issue.

In October 2006, an official "Mayor Luke Ravenstahl's Response Line", 311, was set up. One of its features is the ability to call in and report potholes.

On July 1, 2008, there was criticism from Councilman Bruce Kraus concerning the way in which street paving around the city might be politicized: various city employees have conflicts of interest as they both work for the paving department and sit on neighborhood specific councils. Mayor Ravenstahl announced plans to contract with infrastructure-data firm CarteGraph to track repairs apolitically, plans which don't seem to have publicly materialized.

A report released by the city in early 2009 showed that the city was neither reaching its own goals as to how much it paved, plowed, and de-potholed, nor was it following its own best-practices guidelines for any of those activities.

March 11, 2009, the mayor launched pittsburghpothole.com, a redirect to a pothole reporting form on the mayor's website. The form has just two large fields for entering data about the pothole, and ten fields, all of them marked "Optional", for personal data about the pothole-reporter. It doesn't seem to do more than auto-fire an email towards the mayor's office. It does not send the reporter a confirmation email, or even a way to track the request entered. It is a one way street, almost as bad as tossing requests over a wall.

That same day, City Councilman Bill Peduto called for an approximately $3M system-and-staff that would not only let citizens report potholes and other infrastructure problems, but track their repair for the city. This plan, like the Mayor's hundredth-of-the-price one from a year previous, has not seen further daylight.

It was also reported that the Stimulus Package was sending $4.5M Pittsburgh's way for Community Development. Saith the Mayor, "When specific program guidelines become available, I will be working with members of City Council to help formulate an aggressive paving program." As far as this journalist knows, no such program has been widely announced.

August 2009 the city launched an iPhone application, iBurgh, which let users upload geo-tagged photos and descriptions straight to the city. The app has gotten over 8000 downloads, but it is unclear how many actual issues have been reported via it (and how many of those actually got addressed).

Just last month, the Post-Gazette had a great writeup of what has and hasn't been working (and what Non-Emergency Responses the city does and does not respond to), which included a link to PittMAPS, another wing of the mayor's website.

PittMAPS reports back some amount of data about infrastructure complaints and repairs, though not enough to actually corollate how many pothole reports were responded to, what percentage of pothole fixes were based on reports, etc, just totals for "Potholes Repaired" by quarter, and "Potholes reported" by quarter. Unfortunately, it does so by hosting a series of information-lite pdfs and impossible-to-read jpgs, rather than more easily accessible data (html?). It was reminiscent of the Port Authority website, come to think of it.

I guess that makes sense, considering parts of the mayor's recent inaugural speech (emphasis mine):
"[The city's job] isn't just about paving streets and keeping crime at bay. It's about championing and marketing our neighborhoods to new residents and businesses."
You're right, Mr. Mayor. If there's anything this city isn't about, it's paving streets.